
這是歷史版本頁面 — 看 Visual Studio Community 最新版本
Visual Studio Community 適合哪些開發者用
 Visual Studio Community 17.0
資料更新 2022-11-09
閱讀約 8 分鐘
寫程式寫到一半,發現自己還在用記事本配命令列編譯,程式一多就亂成一團。你想找一套正式的開發工具,把編輯、編譯、除錯、版本控制全部放在同一個視窗裡,但又不想一開始就花錢買商業軟體。尤其當你同時碰 C#、Python、JavaScript,還偶爾想寫個手機 App 或網頁專案時,最怕選到一套裝完才發現語言不支援、外掛裝不了的東西。
免費的程式編輯器很多,但多半只解決「編輯」這一件事。除錯要另外開工具、看效能要再裝外掛、Git 操作又得切視窗,專案一複雜就手忙腳亂。這類整合開發環境(IDE)的切入點,是把整個開發流程收攏到同一個介面:從開專案、寫程式、跑測試、抓 bug,到最後打包發佈,全部在同一套軟體裡完成。Visual Studio Community 就是走這條路的產品,但它的授權和系統限制,決定了它不是每個人都該裝。
01Visual Studio Community 是什麼?拿來寫什麼程式用的?
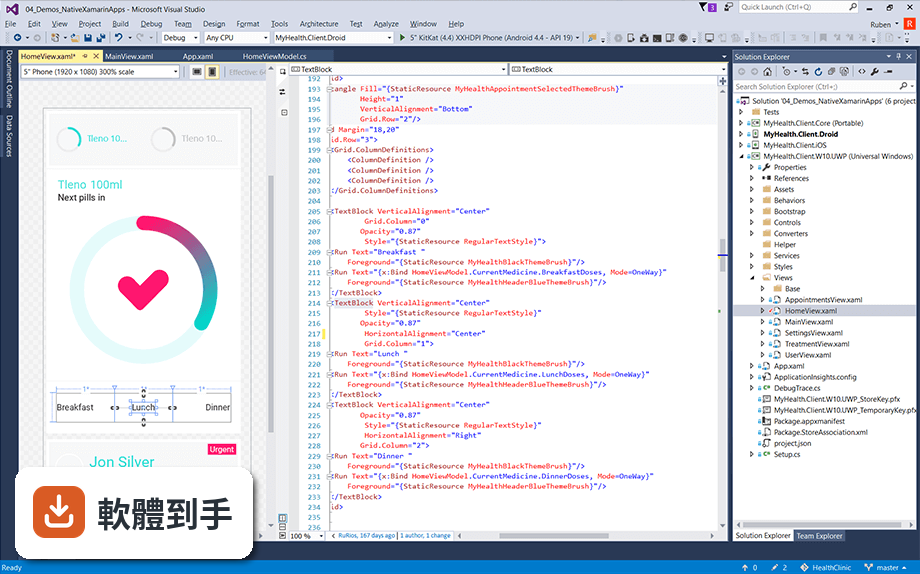
它是一套整合開發環境(IDE),由微軟開發,官方說明指出可用來建立 Android、iOS、Windows 的應用程式,也涵蓋網頁應用程式和雲端服務。支援的專案類型包含 WPF、WinForms、ASP.NET、UWP、Win32 等,等於從桌面程式、網頁後端到手機 App 都在涵蓋範圍內。安裝時可以勾選需要的開發工具組,不需要的功能可以不裝。
02它支援哪些程式語言?
官方資料列出的語言包括 C/C++、C#、Visual Basic、F#、Python,以及網頁開發常用的 JavaScript、ASP.NET、Node.js。另外也提到可搭配 AngularJS、jQuery、Bootstrap、Django 等網頁框架。換句話說,常見的主流語言大多有涵蓋,但如果你用的是比較冷門的語言,就要先確認官方有沒有提供對應的專案範本或外掛。
03除錯和效能分析的功能大概怎麼運作?
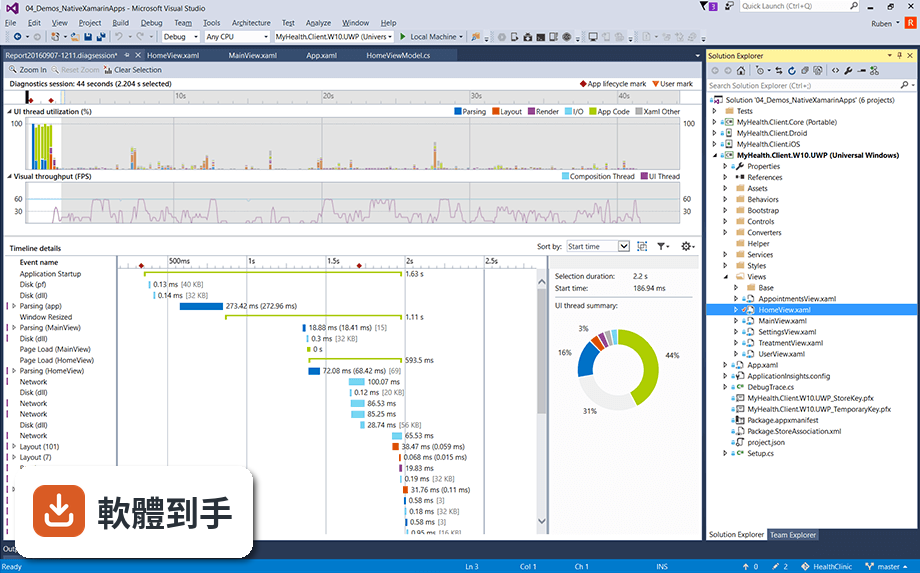
官方說明提到,這套軟體內建除錯工具,可以用來快速找出並修正程式碼問題,也有效能分析工具可以診斷效能瓶頸。另外,XAML 編輯器支援「Edit & Continue」,意思是程式在偵錯模式執行中可以直接修改 XAML 並繼續執行,不用重新啟動。這些功能對需要反覆調整介面或追查執行時期錯誤的開發者來說,是實際會用到的日常工具。
04可以用它開發手機 App 嗎?
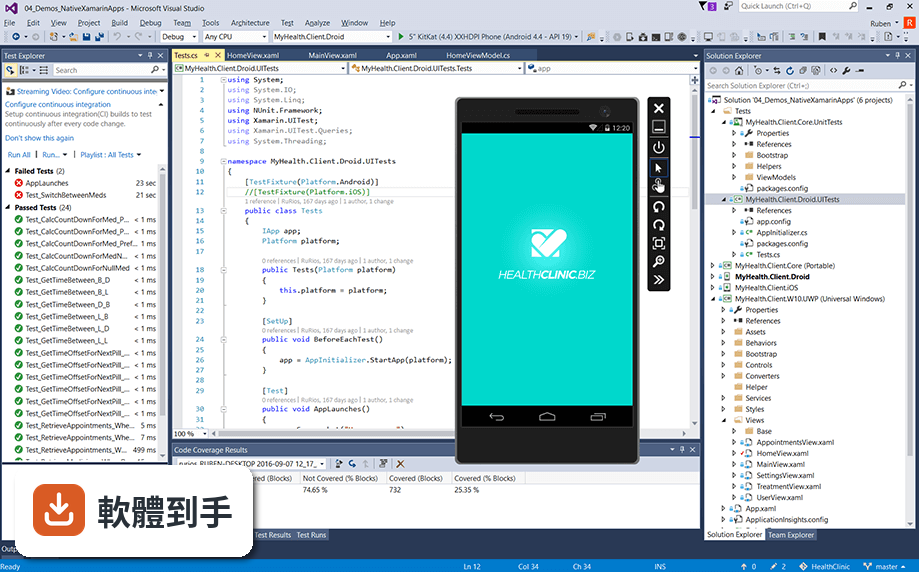
可以,但有條件。官方資料指出,透過下載 Apache Cordova、Xamarin 和 Unity 的相關工具,就能針對更多平台進行程式開發、除錯和測試。也就是說,手機 App 開發不是裝完主程式就有,還要額外安裝對應的工作負載。如果你本來就用 Unity 做遊戲,或習慣用 Xamarin 寫 C# 跨平台 App,這套 IDE 可以當作前端編輯和除錯的介面。
05擴充套件和 Git 整合是怎麼回事?
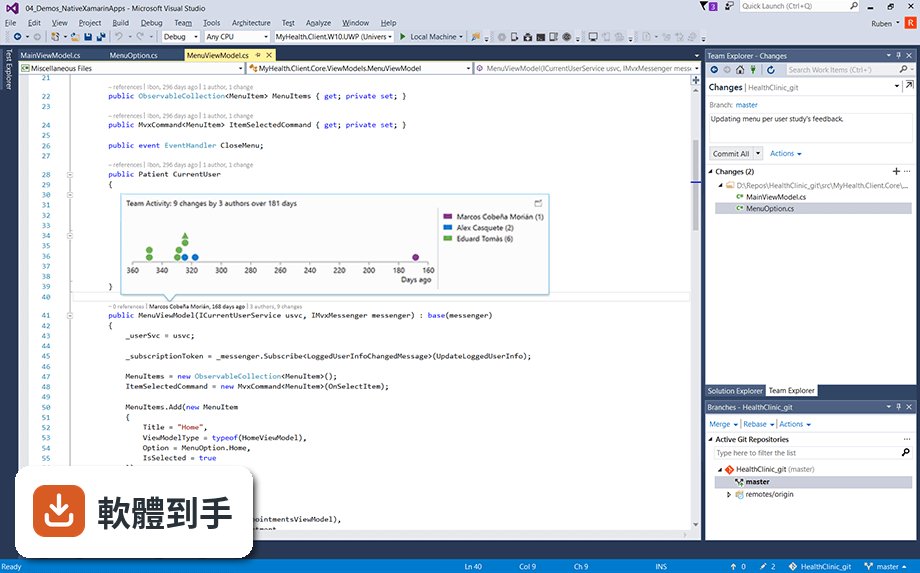
官方說明提到,這套軟體可以存取數千個擴充套件,例如 GitHub Extension、ReSharper、Visual Assist 和 Web Essentials,這些是舊版 Visual Studio Express 沒有的。Git 整合方面,可以直接管理任何代管服務上的 Git 儲存庫,包括 GitHub,也可以在 Team Services 裡把程式碼和 bug、工作項目放在一起管理。換句話說,版本控制和專案追蹤不用另外開網頁或裝客戶端。
06學生或個人開發者用這套合適嗎?
官方在「優點」欄位明確列出「Free for Individual Developers」,也就是個人開發者可以免費使用。但要注意,授權型式標示為 Demo,且官方註明「Cannot be used in an enterprise environment」,意思是企業環境不能用。如果你是自己寫 side project、交作業、或學習程式,符合個人使用的條件;但只要你是受僱於公司、用公司電腦寫公司專案,就不在免費範圍內。
07跟 Visual Studio Express 比起來差在哪?
官方說明直接稱這套是「An updated alternative to Visual Studio Express」,也就是 Visual Studio Express 的更新替代品。差異主要在擴充套件生態:Community 版可以安裝數千個擴充套件,Express 版沒有。另外,Express 版的評分人數有 384 人,Community 版是 161 人,兩者都是微軟出的免費 IDE,但 Express 已經被 Community 取代,新專案建議直接考慮 Community。
08新手學程式用這套會不會太複雜?
官方在「缺點」欄位提到「Complex UI for Beginners」,意思是介面對初學者來說比較複雜。另外也提到「Heavy on System Resources」和「Long Installation Time」,安裝時間長、吃系統資源。如果你只是剛開始學 Python 或 JavaScript,可以先從輕量的編輯器入手;但如果你打算長期走微軟技術棧(C#、.NET、ASP.NET),早點熟悉這套 IDE 的介面反而是好事。
09公司或團隊開發可以用嗎?
不行。官方在授權說明中明確寫了「Cannot be used in an enterprise environment」,企業環境不可使用。另外在「缺點」欄位也提到「Limited for Large Teams」,對大型團隊來說功能有限。如果你的公司要開發商業軟體,需要改用付費的 Visual Studio 版本,或找其他授權允許商業使用的 IDE。這點在安裝前就要先確認,免得寫到一半才發現授權不符。
10我的電腦只有 Mac,可以用嗎?
官方頁面有提供「Download Visual Studio Community for Mac」的連結,也有使用者搜尋過「visual studio community for mac」和「visual studio community edition for mac」,代表確實有 Mac 版本存在。但要注意,這份資料的系統需求欄位只列出 Windows 10(64-bit)和 Windows 11,Mac 版的系統需求、功能完整性與更新狀況,需要到微軟官方網站另行確認。
11介面只有英文,對中文使用者有影響嗎?
這套軟體的介面語系是 English,沒有內建繁體中文介面。對習慣英文介面的開發者來說影響不大,因為程式碼本身也是英文為主;但如果你對 IDE 的操作選單不熟,英文介面會增加學習成本。官方沒有提供中文語系套件的相關資訊,如果你需要中文介面,可能要考慮其他有中文化的 IDE,或自行尋找語言包(官方是否支援需自行確認)。
12這套軟體更新頻率如何?會不會裝了沒多久就過時?
根據版本紀錄,這套軟體最早收錄於 2017 年,最近一次更新在 2026 年,但近 12 個月只更新 1 次,近 24 個月也只更新 1 次。以 IDE 來說,這個更新頻率偏低。如果你需要頻繁獲得新功能或新語言支援,可能要留意官方是否有穩定的釋出節奏;如果只是寫既有專案,低更新頻率反而代表環境穩定,比較不會突然改版打亂工作流程。
下載與官方連結
前往官方網站 下載 Visual Studio Community
Visual_Paradigm_CE_17_0_20221107_Win64.exe · 連結指向軟體原廠
版本紀錄
- 2026-08-12 Microsoft Visual Studio Community 2026 Insiders 5.4 MB
- 2024-02-22 Microsoft Visual Studio Community 2022 17.9.1
- 2024-02-14 Microsoft Visual Studio Community 2022 17.9.0
再看 5 筆
- 2023-11-29 Microsoft Visual Studio Community 2022 17.8.2
- 2023-08-30 Microsoft Visual Studio Community 2022 17.7.3
- 2023-08-09 Microsoft Visual Studio Community 2022 17.7
- 2022-11-30 Microsoft Visual Studio Community 2022 17.4.2
- 2022-11-16 Microsoft Visual Studio Community 2022 17.4.1
這一版改了什麼
What's new in this version:
Visual Paradigm Community Edition 17.0
Usability enhancements for team projects:
- Version 17.0 comes with an improved usability that focuses on making team work easier and faster. Various new features and critical changes are made to the features below:
- Model searching
- Better way to manage the deployment of plug-in
- Teamwork Server - Administration features
- Project creation
Huge usability boost for Enterprise Model Finder:
- The Enterprise Model Finder allows you to find model elements from within team projects quickly. Version 17.0 comes with a number of major changes that make the searching of data faster and the result easier to understand.
- Revamped layout: Results are displayed tidily in a table
- Expand search result progressively
- Search only the project(s) you interested with the new search scope feature
- Filter the model type you interested
Manage the rollout of plug-ins with Visual Paradigm Server:
Visual Paradigm supports a powerful API that allows you to add custom functionality by writing plug-ins. In version 17.0, project teams can manage the roll-out of plug-in by using Visual Paradigm Server. The changes are summaized below:
- Supported uploading custom plug-in to Visual Paradigm Server
- Users can connect to the server to install plug-ins
Project template - Get a head start on your work:
- Lets team members create a project by choosing a project template stored in your Visual Paradigm Server workspace
Unlike starting a project from scratch, a project template gives you the initial data you need to get started. Depending on the nature of your projects, your project templates could include corporate workflows, guidelines, glossary, and more. A project template simply allows you to get a head start on your work. Here are the benefits of start a project with a template:
- Save time and effort that might otherwise be lost in creating repetitive project content
- Establish common project bases for different users or teams to work on with
- Build consistency between similar projects
Manage team projects with folders:
Keep your teamwork projects directory organized using folders. In version 17.0, both the server and client are enhanced to improve the use and visualization of folders. Here is a list of actions you can perform:
- Create new project in a specific folder
- Open, switch and browse project through a project folder tree
Enhanced VP Server report and log:
The VP Server report is enhanced to present more information and in a more reader-friendly manner. Here are the changes:
- Information added: The member by which a project is deleted
- Information added: The date/time of the deletion of a project
- Use a separate worksheet to display the log related to project deletion
SysML enhancements:
- The following changes are made to the SysML modeling tools:
- Supported showing inherit receptions
- Supported defining OpaqueAction
- Supported the display of Quantity kind on value type
- Supported showing symbol and unit with the value type used
- Supported the creation of few more types of transition effects (UML Activity)
- Several enhancements on State Machine Diagram (related to SysML)
Layer based diagram comparison:
- The Visual Diff feature helps you compare two diagrams by showing their differences in a visual way. If you have ever created separate layers to organize the content of diagrams, you may find Visual Paradigm 17.0 useful because you can now narrow down the comparison to a specific layer in the diagram. This allows you to focus on specific kinds of data without being tied to changes that are not of interest.
New online diagrams: 3 breakdown structure chart:
Three new breakdown structure charts are introduced in version 17.0:
- Resource breakdown structure: a list of resources needed to deliver a project, presented in a structured manner
- Risk breakdown structure: Breaks down project risks starting with higher-level categories and continuing down into sub-levels of risk
- Functional decomposition diagram: Visualize the whole function or project along with all of the necessary sub-tasks needed to complete it.
New online diagrams: Functional Flow Block Diagram:
- Functional Flow Block Diagram (FFBD) is a flow chart of a system's functional flow. While FFBDs primarily focus on sequencing, it also expresses input and output data dependencies between functional blocks.
Enhancements for ArchiMate editor:
Two enhancements are made to our ArchiMate modeling tool:
- Project level presentation options for ArchiMate shapes (box vs symbol)
- Symbols are grouped by domains. These groups can be expanded and collapsed, so that you can focus on modeling with symbols from a particular domain without being side tracked by other symbols.
Doc. Composer enhancements:
Here are some of the highlighted changes made for Doc. Composer in version 17.0:
- Supported setting height for
- Supported apply margin-bottom on description property
- Supported outputting the changes between two revisions to a report
Visual Paradigm Community Edition 16.3
- Change log not available for this version
Visual Paradigm Community Edition 16.3
- 40 new chart types are added in the latest version of Visual Paradigm, each with a number of professionally designed chart templates for you to start quickly
OpenAPI (formerly Swagger) support:
- Design RESTful API and generate API definition in accordance with the OpenAPI specification. Two enhancements are made in the latest version of Visual Paradigm
- Support of OpenAPI specification v3 in API generation
- Supported importing Swagger, OpenAPI, YAML and JSON
Matrix enhancements:
- Identify the relationships among model elements with the use of a matrix. Two enhancements are made in the latest version of Visual Paradigm
- Supported multiple relationship types
- Supported showing elements' user ID in matrix's column and row header
Org. chart descendant's layout:
- Switch between the layouts of branches in an org. chart with one click. By default, org. chart units are arranged horizontally. You can switch to a vertical layout by right clicking on the diagram and selecting Presentation Options > Descendant Layout > Vertical from the popup menu.
Doc. Composer enhancements:
- Doc. Composer is a flexible document-generation-tools that allows you to create any kind of report you need. It features a rich collection of element templates that outputs different content from your model, in different layout and styles. You just need to drag and drop the templates you need onto the report, and that's it!
- In the latest version of Visual Paradigm, two enhancements are made -
- Supported organizing user-defined templates with folders
- Supported outputting PostMania post content to report
Shows package structure in name completion:
- The name completion feature provides a handy way to reuse existing elements. By typing a part of an element's name and hitting Ctrl-Space, a list of elements whose names match the entered text would appear. You can then select a name to reuse an element.
- In the latest version, a minor enhancement has been made to help you identify the location of a model element. Just by placing your mouse pointer over a name, its fully qualified name would appear as tooltip. This is particularly useful when there are multiple elements sharing the same names.
Show/hide call message return type:
- When an operation with return type is set to a sequence message as its operation, the name, parameter and return types of the operation would be presented. Now, you can hide away the return type of operations in sequence diagram.
Hexagonal Architecture Diagram:
- Hexagonal Architecture Diagram is a visual representation of hexagonal architecture. It aims at creating loosely coupled application components that can be easily connected to their software environment by means of ports and adapters. This makes components exchangeable at any level and facilitates test automation.
- The latest version of Visual Paradigm provides the symbols and templates you need to create your Hexagonal Architecture Diagram
4Qs Framework:
- The 4Qs framework is a framework for designing a sales system. It provides four distinct quadrants to organize staff and their processes, breaking down departmental barriers and making it easier for staff to anticipate how change can be made across the business.
- The latest version of Visual Paradigm features a number of 4Qs framework templates to support your planning and brainstorming needs
Re-arrange items in a CJM cell:
- Re-arrange touch-points, user actions, and any cell items in a Customer Journey Map easily with the new move up/down function
More primitive shape types:
- Supersede the default appearance of a shape by choosing a primitive shape type you preferred. The latest version of Visual Paradigm supported a number of new shape types. Now, you can select rectangle, rounded rectangle, oval, triangle, octagon, diamond, pentagon, trapezoid and hexagon.
Visual Paradigm Community Edition 16.2
- Change log not available for this version
Visual Paradigm Community Edition 16.1
- Change log not available for this version
Visual Paradigm Community Edition 16.0
Large-Scale Scrum Canvas:
- Large-Scale Scrum Canvas is a scrum tool built for every scrum team to plan, track and manage scrum projects through an intuitive visual canvas. Whether your software project involves a single team or multiple teams around the world, we keep everyone on the same page, same canvas.
Navigate project with ease:
- Manage product backlog, sprint planning, impediment, daily scrum, sprint review and other Scrum events and artifacts from within the same place - the Large-Scale Scrum canvas
- Works for any scale projects
- Dedicated canvas for every Scrum team to access the project and sprint details relevant. The canvas is designed to help make large-scale development efficient
Improve communication:
- Effectively communicate ideas the with documents generated from the information gathered under work items
- To use this feature, select Agile > Large-Scale Scrum Canvas from the toolbar
- LeSS (Large-Scale Scrum), is a trademark of The LeSS Company B.V
Form Builder - Design Your
- We support your data collection needs by introducing a new form builder that is feature-rich and intuitive. You can create your own forms using our drag-and-drop form builder that has all the layout tools, form fields and flexibility you need. Choose from a vast collection of form templates to create registration forms, order forms, feedback forms and more
Drag-and-drop form designer:
Rich collection of form objects:
- A rich set of fields is there to support both standard and advanced form design needs - text, image, choices, boolean, separator, etc.
Flexible layout:
- Easily adjust the ratio of fields through dragging the slider between fields. The result will reflect instantly as you drag.
- You can create a Form through the New Diagram window.
- Form sharing and data collectors
Share your form with your target audiences via a secure link or embed it into a page on your website:
- Web link: share your form via a secure link. We host your forms and help you collect the data you need to get business done.
Embedded code:
- An engaging form on your website is a great way to collect the information you need from your target audiences. You can embed your form seamlessly into a page on your website to collect data
Form Builder - Form Data Browser:
- Collected data can be viewed in a summary table or directly in the form editor. You can also export data in CSV format.
- Brosing form results
Quality control toolset:
- Quality control experts make use of the so-called "7 Basic Tools of Quality" to improve their organizations as part of an overall quality control effort. The 7 tools are graphing techniques that are commonly used for quality control troubleshooting purposes. Visual Paradigm features these 7 tools, along with a unique dashboard-like feature that helps you manage the use of these tools in different quality initiatives.
- 3 new chart makers for quality initiatives
- Our quality control toolset is enhanced to support three new chart types. Together with our flowchart maker, check sheet tool, scatter chart maker and cause and effect diagram tool, you can now perform quality with the help of all the 7 basic quality tools
Pareto Chart:
- Pareto Chart is a combination of bar chart and line chart, where individual values are represented in descending order by bars, and the cumulative total is represented by the line
Control Chart:
- Control Chart helps in studying whether a process is in control or not. In a Control Chart, process mean is plotted at center and the upper and lower control limits are plotted on both sides of it. The values lying outside the control limits indicate that the process is out of control
Histogram:
- Histogram is a kind of bar chart that shows the distribution pattern of data. Histograms are useful in studying patterns of distribution and in drawing conclusions about the process based on the pattern
Quality Control Canvas:
- Quality Control Canvas is a management tool that helps you manage your charts and diagrams created for quality initiatives. The canvas provides you with direct access to the various quality tools such as flowchart, control chart, cause and effect diagram, pareto chart, etc. You can simply click on a tool to start creating your chart and diagram
Dashboard of quality tools:
- Access to all the seven quality tools within the same place - the canvas. You don't have to move between pages and applications to find the tool you need
Keep all your works in one place:
- Each item in the canvas stores all the charts in same type, which makes it easy for you and your colleague to access your work
Intuitive chart editor:
- Easily input your data in a spreadsheet editor. The chart preview enables you to view the result instantly as you input your data.
To use this feature, select Tools > Quality Control from the toolbar.
Multiple templates to fit different quality initiatives:
- Multiple quality control templates are provided to support the different kinds of quality control needs
7 Basic Quality Tools:
- The 7 Basic QC Tools QC template provides quick access to the seven simple yet effective "tools of Improvement" suggested by Kaoru Ishikawa, one of the quality management gurus. The tools are widely used as visual problem-solving tool and as general management tools in design and delivery processes
Six Sigma (DMAIC):
- Six Sigma is an organization-wide approach used to specify how organization managers set up and achieve objectives. Six Sigma prescribes an improvement process called DMAIC. The DMAIC QC template visualizes the classification of different quality tools in the Six Sigma methodology.
PDCA:
- The PDCA-cycle is popular management method used for the continuous improvement of business processes and products. The PDCA QC template visualizes the use of quality tools in realizing continuous improvements throughout a PDCA cycle.
- Visualize your business model in a nice one-page canvas. The latest version of Visual Paradigm features an intuitive Business Model Canvas editor for you to build your Business Model Canvas quickly.
Business Model Canvas:
- You can create a Business Model Canvas through the New Diagram window
- Business Model Canvas is designed by Strategyzer.com
- The Business Model Canvas is licensed under the Creative Commons Attribution-ShareAlike 3.0 Unported License
- Rich collection of professionally designed template
- Create your own Business Model Canvas with our pre-developed templates. No matter what niche you are in, you will be able to find a template that fits your need well. While you can use them all as they are, feel free to add your personal touch and customize them
- Basic
- Basic (Iconless)
- Basic (Watermark)
- Basic (Bullet Points)
- Icy
- Green Bean
- Blueberry
- Strawberry
- Elegant
- Navy
- Vibrant
- Bricks
- Lemon Tea
- Turquoise
- Wasabi
- Grapes
- Summer Fiesta
- Latte
- Light
- Traveling
- Blackboard
- Categorized
Analysis Canvas Tool - Build Your Own Canvas:
- If you want a way to capture and organize your ideas, then an analysis canvas is a useful, quick and easy way to do so. Categorize your ideas by splitting a canvas into multiple partitions. Add memo and sticky notes into the partitions to describe your ideas. Publish the canvas online and share it with your co-workers, partners and friends. Visual Paradigm provides a convenient Analysis Canvas tool that helps you achieve all these.
Analysis Canvas Tool:
Build your Analysis Canvas with ease:
- Build your canvas with ease
- Start from a pre-defined template or from scratch. Structure your ideas into different partitions with simple steps. Adjust the cell size by dragging the splitter.
Rich collection of memo and sticky notes:
- Jot your thoughts and ideas down onto the canvas as they develop and grow, using sticky notes and memos. A rich collection of notes and memos is provided. They have different looks and colors that serve and fit different needs and preferences.
100+ pre-designed Analysis Canvas templates:
- Over 100 professionally designed Analysis Canvas templates with ready-to-use layouts and icons are available. They serve as good starting points for you to build your own canvas
- 4 Quarters Canvas
- Contract Canvas
- 12 Months Canvas
- 4: Retrospective Canvas
- Personal Agility Canvas
- User Story Conversation
- Agile Sprint Rpt. Canvas
- Basic Kanban Canvas
- Milestone Mgmt. Def.
- Lean Change Canvas
- Project Canvas
- Project Canvas II
- Project Kick-Off Canvas
- Maker Project Canvas
- Program Canvas
- Change Mgmt. Canvas
- Behavior Change Canvas
- Data Canvas
- Project Charter Canvas
- Business Model Zen
- Business Model Archit.
- GovTech Business Model
- Open Business Model
- Business Model Inno.
- Universal Business Mdl.
- Mobile Application
- Partnership Canvas
- Partnership Match
- Elevator Canvas
- Service Model Canvas
- Co-creation Canvas
- Storytelling Product
- Process Model Canvas
- Digital Policy Model
- Context Map Canvas
- SAAS Business Canvas
- Operating Model Canvas
- Value Model Canvas
- Enterprise Design
- Business Support
- Business Pivot Canvas
- Outcome Based Map
- Social Business Model
- Business Analysis
- Ideation Canvas
- Universal Prob. Solving
- Kanban Canvas v1.0
- Go-Product Roadmap
- Product Development
- Product Management
- Hardware Product
- Minimum Viable Canvas
- Product Design Canvas
- Game Design Canvas
- 1-Page Game Design
- Design Thinking Venture
- Prototype Canvas
- Timebound Project
- Requirements Discovery
- User-Centered Design
- Platform Value Canvas
- Platform Idea Canvas
- Focused Innovation
- Open Innovation Project
- Innovation Project
- Employer Branding
- Product/Market Fit
- Customer-Value Canvas
- Strategic Partnership
- Digital Strategy Canvas
- Mission Model Canvas
- Core Story Canvas
- Cloud Strategy Canvas
- Product Vision Board
- Product Vision Board (Ext)
- Life Model Canvas
- Social Lean Canvas
- SWOT Canvas
- Opportunity Analysis Canvas
- Startup Analysis Canvas
- Startup Canvas
- Startup Marketing
- Market Analysis Canvas
- Disruption
- Deep Learning AI Canvas
- Experience Canvas
- Machine Learning
- Learning Ecosystem
- Consupremo API Canvas
- MVP Canvas
- Personal Impact Canvas
- Full Time Living Inno.
- LernOS Canvas
- Course Design Canvas
- HR Innovation Canvas
- Collaborative Creativity
- Employee Experience
- Team Canvas Basic
- Role Expectation Map
- Healthcare Lean Canvas
- Feedback Canvas
- Process Connector
- No more process silos! Manage your enterprise, business and IT processes with our all-round process management tools, and have they integrated using Process Connector. Process Connector provides process designers an option to establish a navigable linkage from one process to another. No matter you are working on Guide-Through process like TOGAF ADM Guide-Through, Just-in-Time process like PMBOK Just-in-Time or Process Canvas like Scrum Process Canvas, you can connect them using Process Connector.
- To use Process Connector, unlock your Guide-Through Process / Just-in-Time Process / Process Canvas to enter editing / authoring mode.
30+ new online diagrams:
- 30+ new types of diagram have be added into Visual Paradigm since V.15.2 ranging from software design, business design, UX design, flowcharting, quality control, mind mapping, cloud architecture design, and to decision analysis, etc. You want even more new types of diagram to fit your specific need? No problem! Simply suggest them in the User Forum
30+ new online diagrams:
- Software and business design
- Enterprise Integration Patterns diagram tool
- Enterprise Integration Patterns
- System context diagram tool
- System context diagram
- Arrow diagram software
- Arrow diagram
- Problem flow diagram tool
- Problem flow diagram
- Information flow diagram software
- Information flow diagram
- Affinity diagram tool
- Affinity diagram
- Interrelationship diagram tool
- Interrelationship diagram
- Causal loop diagram tool
- Causal loop diagram
- Enterprise architecture diagram tool
- Enterprise architecture diagram
- Dendrogram maker
- Dendrogram
- Flowchart makers
- Cross-functional flowchart maker
- Cross-functional flowchart
- Microsoft Azure
- SDL diagram
- Audit flowchart maker
- Audit flowchart
- Accounting flowchart maker:
- Accounting flowchart
- Organizational chart makers:
- Family tree maker
- Family tree
- Genogram software:
- Genogram
Kinship diagram maker:
- Kinship diagram
- Quality control diagrams
Threat modeling tool:
- Threat model
TQM diagram tool:
- TQM diagram
- Fault Tree Analysis software
- Fault Tree Analysis
- UX design
Site map diagram tool:
- Site map diagram
- Material design wireframe tool
- Material design diagram
- Atlassian wireframe tool
- Atlassian wireframe
- Wired UI diagram tool
- Wired UI diagram
- Fluent Design wireframe tool
- Fluent Design wireframe
- Mind Mapping
Concept map diagram tool:
- Concept map diagram
- Bubble diagram maker
- Bubble diagram
- Seating chart
- Create beautiful and professional seating chart in minutes with the help of the drag-and-drop feature and the full set of seating plan icons and props.
- Event Hall Seating Plan
- Banquet Hall Seating Plan
- Banquet Hall Seating Plan
- Restaurant Seating Plan
- Restaurant Seating Plan
- Huawei Cloud architecture diagram
- Design your Huawei Cloud architecture using the Huawei Cloud architecture tool. Full set of ready-made Huawei cloud symbols that help you accurately communicate your design ideas through Huawei architecture diagrams.
- Enterprise-level disaster tolerance service:
- Enterprise cloud disk solution
- Enterprise cloud disk solution
- SAP common architecture
- SAP common architecture
- Decision analysis and others
Decision tree tool:
- Decision tree
Timeline diagram:
- Turn your Google Sheet data into beautiful chart
- Turn your Google Sheet data into beautiful chart
- Automatically form a chart from data entered in your Google Sheet. With auto refresh, changes you made in the sheet will reflect in the chart automatically, keeping your work consistent.
Kerberos authentication:
- Kerberos is a network authentication protocol designed to provide strong authentication for client/server applications by using secret-key cryptography. Your team can now authenticate through Kerberos
Kerberos authentication:
- Edit Customer Journey Map's chart data via full editor
- You can use charts in a Customer Journey Map to represent statistical data. The experience of editing is now improved. You can now edit chart data via the full spreadsheet editor
Visual Paradigm Community Edition 15.2
- Change log not available for this version
Visual Paradigm Community Edition 15.1
- Minor bugfix
Visual Paradigm Community Edition 15.0
- Wireflow diagram - A wireframe-based flow chart: Wireframes is a widely adopted UX tool that allows designer and client to work together in identifying the content and functionality of screens. A wireflow makes UX even more effective by harnessing the power of wireframe and flowchart, creating a step-based UX diagram that illustrates the steps and decision points of particular scenarios and the possible navigation paths throughout these steps.
- Animating Wireflow diagram: As long as a user interaction involves alternate and exceptional cases, there are multiple paths of wireflow that can be navigated. To reduce the application complexity, the wireflow editor allows you to specify a particular path (or often called scenario) of wireflow to be animated, so that we can split a user feature to be in sync with the partition of a simple user story or testing scenario.
- STEPS Wizards: Analysis and Design Step-by-Step: Seamless Techniques Expressed in Prescribed Steps (STEPS) is a powerful and groundbreaking feature for software development. Like a recipe that tells you how to cook a meal, STEPS are recipes that lead you through a series of well-defined steps for conducting a particular (reusable) analysis or modeling pattern for certain aspect of your development process. Your team can reuse or choose the appropriate Wizard in your project from the default set provided by Visual Paradigm.
- Visual API designer for Swagger and API Blueprint: Design, describe and document RESTful API in a total graphical way. You can design RESTful API easily by creating simple Class Diagram, like the one below. The graphical design approach, along with our award-winning diagramming interface make API design simple, straight-forward and error free.
- Visual Paradigm Online: After five years of consolidation, our dedication of high quality service in Agile Development has positioned VPository as one of the leading platforms in the agile and visual modeling industry. To reflect this tremendous expansion of VPository, we announce the update of the brand identity from VPository to Visual Paradigm Online ("VP Online") to re-message the products and online services we supply.
- On-Demand Model ETL: Design your desirable views of model data in a tabular form for bulk-view/edit/prioritize/visualize using Model ETL big data technology.
- Upgrade to Hibernate 5.1: To ensure that your work continues to remain secure and robust, we have upgrade our ORM support to use Hibernate 5.1, the latest version of Hibernate.
Visual Paradigm Community Edition 14.2
Visual Paradigm 14.2 introduces a number of new features, which includes:
- Customer Journey Mapping (CJM)
- Automatic document generation from Customer Journey Map
- On-Demand Model ETL
- Tailoring Just-in-Time Process with custom diagrams and text
- Target-First BMM Guide-Through Process
- Baseline-First BMM Guide-Through Process (Extended version of the ordinary process)
- Automatic visualization of BMM traceaibilities with ArchiMate diagram
- Supported specifying stewardship for Means elements in BMM Guide-Through
- New deliverable for BMM Guide-Through: Business Motivation Model
- Online State Machine Diagram tool
- Online Activity Diagram tool
- Online Component Diagram tool
- Online Deployment Diagram tool
- Online Package Diagram tool
- Supported mixed use of notations for online diagrams (e.g. to draw Actor in Class Diagram
- Supported keeping commonly-used shapes for cross-diagrams reusability
- Supported importing palette from user-imported images (e.g. svg, png, jpg)
- Supported importing palette from Visio .vssx
Enhancements to Visual Paradigm 14.2 includes:
- Re-Designed Assessment form in BMM Guide-Through for better documentation of influencers' impacts
- Supported customizing the heading text for the document generated from a Just-in-Time form
- Supported customizing the prefix and suffix of content blocks in document generated from a Just-in-Time form
- Supported bi-directional project reference
- ArchiMate 3.0.1 connection rules
- Supported marking a PostMania topic as resolved
- Supported cloning member in VPository and Teamwork Server
- Supported different scope settings for rows and columns in matrix
- Supported automatic check-out of referenced project
- Re-designed product start page
Visual Paradigm Community Edition 14.1
General Fixes/Enhancements:
- Fixed no response when attempting to import a non-supported diagram type from Visual Paradigm Community Circle
- Fixed unable to mirror an element from referenced project
- Fixed not handling physical, logical and conceptual elements in ERWin importing
- Fixed diagram image preview not fully shown in Doc. Composer
- Fixed a VPository subscription issue
- Fixed wrongly allowed creating sub-diagram on locked model when create via New Diagram window
- Fixed a wrong referenced project path checking in using referenced project
- Fixed a compile error related to generated ORM code
- Fixed a potential hang issue related to pasting content into a form (TOGAF ADM Guide-through)
- Fixed a couple of issues related to C++ round-trip
- Fixed an undo issue related to Fact Model
- Fixed image exported for Maturity Analysis crops part of the label
- Fixed cannot drag & drop entity from reverse result to diagram on Mac
- Reduced VPository's subscription time
- Renamed Fact Diagram to Fact Model
- Removed the restriction of inner stage cannot exceed outer stage in Maturity Analysis
- Made UeXceler, Tasifier and PostMania enabled by default when creating a new project
- Made User Interface Diagram publicly available
- Made the selection of Just-in-Time process template unspecified by default in New Diagram window
- Supported retrieving the Doc Field for document components in Doc. Composer
- Supported retrieving the URI to use in developing plug-in for components in Doc. Composer
Scrum:
- Fixed UeXceler sometimes not working
- Fixed requirements under use case not being published to Project Publisher
- Made user story fall back to Affinity Table upon a failed attempt to move it to Spike List via drag and drop
Guide-through Process:
- Fixed duplicated deliverables in Architecture Repository
Online Drawing Tools:
- Fixed several issues related to activation editing in sequence diagram on web